What NFL Team Should I Support?

Ever wondered what NFL team you should support? This post uses statistics and machine learning to determine similar NFL and Premier League teams. Find your favourite Premier League team and see what similar NFL teams there are.
American football is becoming increasingly popular in the UK. My interest in the NFL started in the early 2010’s, eagerly anticipating Superbowl Sunday every February (and then regretting staying up so late at school the next day!). One of the things that makes sport so special is having a team to support. Yes we can all appreciate incredible sport and watching two neutral teams battle it out in major finals but this takes a whole new level when one of the teams is ‘your’ team.
So how do people choose ‘their’ team? For most people this isn’t much of a choice; you support your local team or the team your family support (we won’t mention those people who pick the ‘best’ team and then make up some pretend connection as to why they support them). However, as the NFL is based in the US and most peoples family don’t support an NFL team, how should we go about choosing a team. I decided there must be a clever way to pick a team that is statically similar to the team I already support and hence this post was born!
In this post, I’m going to match/group/cluster NFL and Premier League teams based upon their similarities. This analysis is performed on data from the 2019/2020 season (an update once the 2020/2021 Premier League season has finished will follow). The data was obtained from https://www.football-data.co.uk/englandm.php and https://github.com/leesharpe/nfldata and all analysis was performed in R. Access to the R code used for the analysis can be accessed from the project report.
As a football fan, you can find the Premier League team you support and you will be able to see similar teams from the NFL. Alternatively, if you are from the US, this post can be used in reverse to pick a Premier League team. If you don’t care about how the final groupings were made feel free to scroll to the bottom of the page where you will find the table of groupings. If you are interested in more details, you can find the full project report and code here.
Defining Similar Teams
To be able to group similar teams we need some way of measuring how similar they are. There are many factors we could use to measure similarity including:
- League position
- Number of goals scored/conceded
- Average game attendance
- Number of titles won
- Many more …
However, we also want to be able to visualise the teams, their strengths and the final groupings. Hence, choosing two metrics for each team will allow us to plot this and visually compare the different teams. Hence, we choose to create an attacking and defensive strength for each team.
Creating Attacking and Defensive Strengths
So how to we measure a teams attacking and defensive strength? Well attacking teams generally score lots of goals and defensive teams generally conceded very few goals (throughout goals will be used to refer to points in the NFL). So lets set the attacking strength of a team as the number of goals scored and the defensive strength as the number of goals conceded. Lets visualise this by seeing the average number of goals scored and conceded by each team in each game across both leagues.
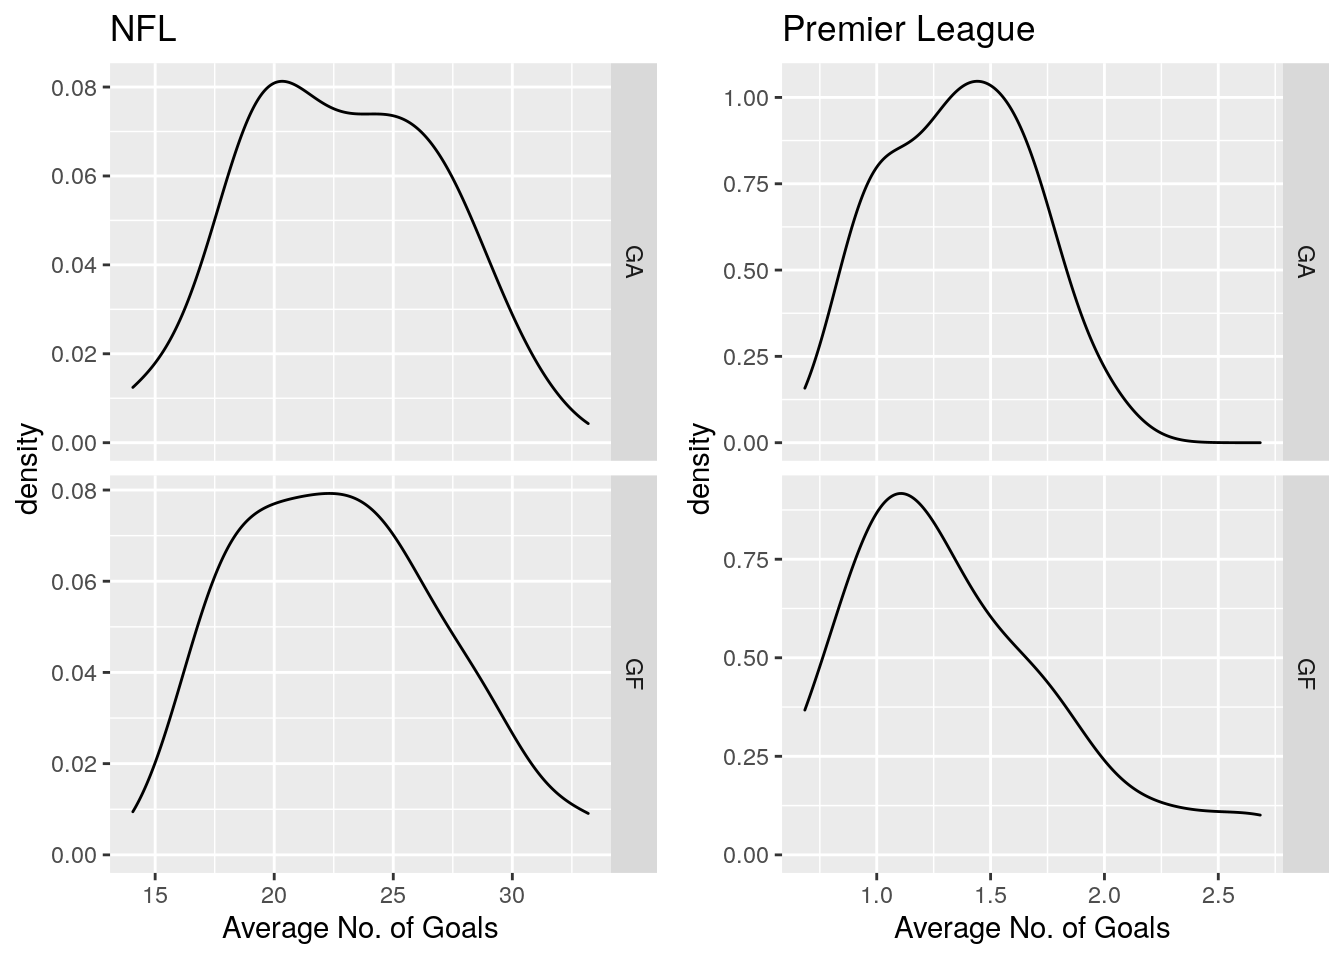
We’ve run into a slight issue! We can see in the NFL scores can vary massively from the low 10’s to anywhere near 40 goals, where as in the Premier League the number of goals is normally in the low single digits.
No worries though, we can solve this issue by scaling the number of goals scored and conceded in some way to make the attacking and defensive strengths comparable across the two leagues. To do this we will do the following:
- Take the number of goals scored/conceded by each team
- Subtract the league average
- Divide by the league standard deviation
- For the defensive scores we multiply by -1.
This scaling means if a team has a attacking score greater than zero then they are better than the league average for the number of goals scored. Similarly, a high defensive score means they are better defensively (note the multiplication by -1 in step 4).
Enough talking, lets see what these attacking and defensive scores look like. We start by looking at the Premier League Teams. The dashed line is the where the attacking and defensive scores are equal not the line of best fit!
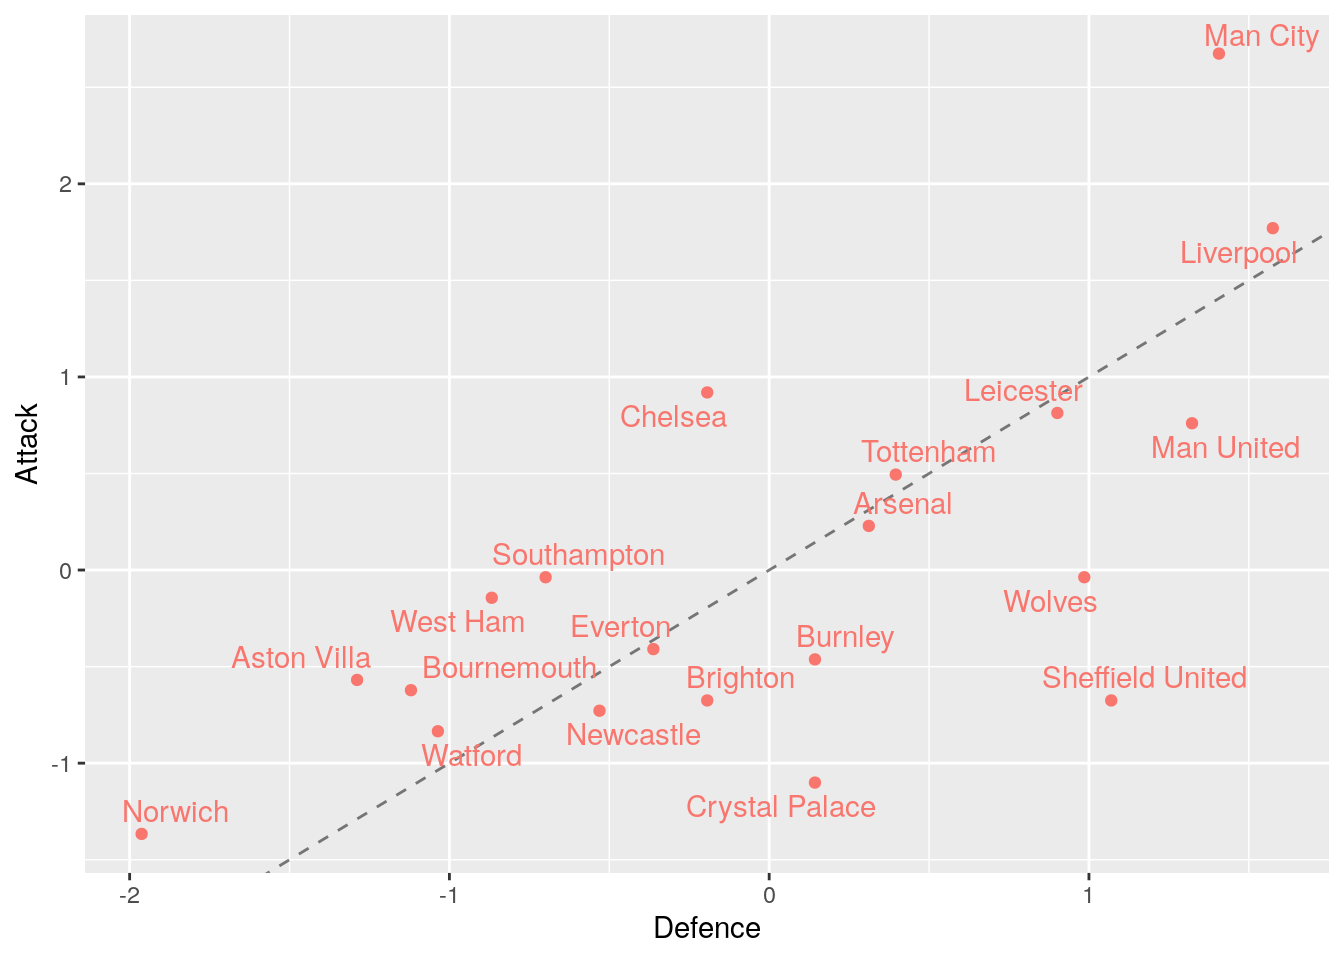
We can see there is clear correlation between the attacking and defensive scores. This is to be expected, generally the teams at the top of the division (Man City and Liverpool) will have a better attack and defence than the teams lower down the division (Norwich). However, there is still some interesting points. We can see Sheffield United have a much better defensive score than attacking score (I think most pundits would agree with this assessment) while Chelsea have a much better attacking score than defensive, which again matches what we saw in the season.
So now onto the NFL teams and to interpret this plot your going to need to know your NFL team acronyms. Either treat this as a fun guessing game or go see your great friend Google.
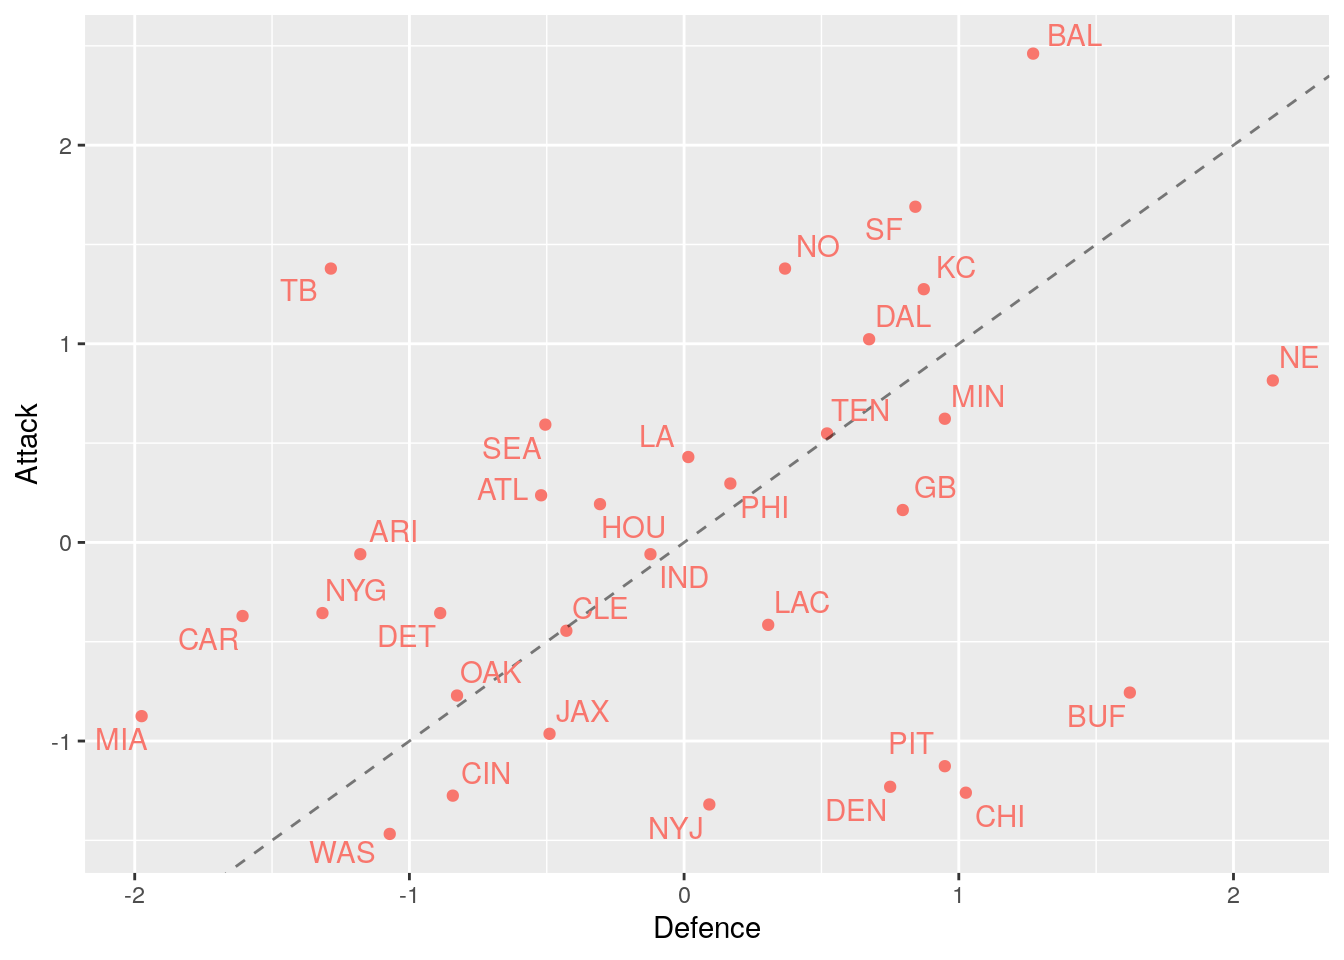
We see the NFL teams are more spread out and this is reflected in the data as the attacking and defensive scores are less correlated in the NFL. This is probably due to NFL teams having completely separate offensive and defensive players. Again, we can see the best teams near the top right (Baltimore Ravens) and the teams that had weaker seasons near the bottom left (Miami Dolphins). Interestingly, there were 5 worse teams than Miami in this season yet Miami seems to have the worst attacking and defensive scores - shows we were right not to just use league position!
Grouping the Teams
The moment we’ve all been waiting for, lets plot all the teams together! Hopefully, we should see some natural groups of teams from the two leagues.
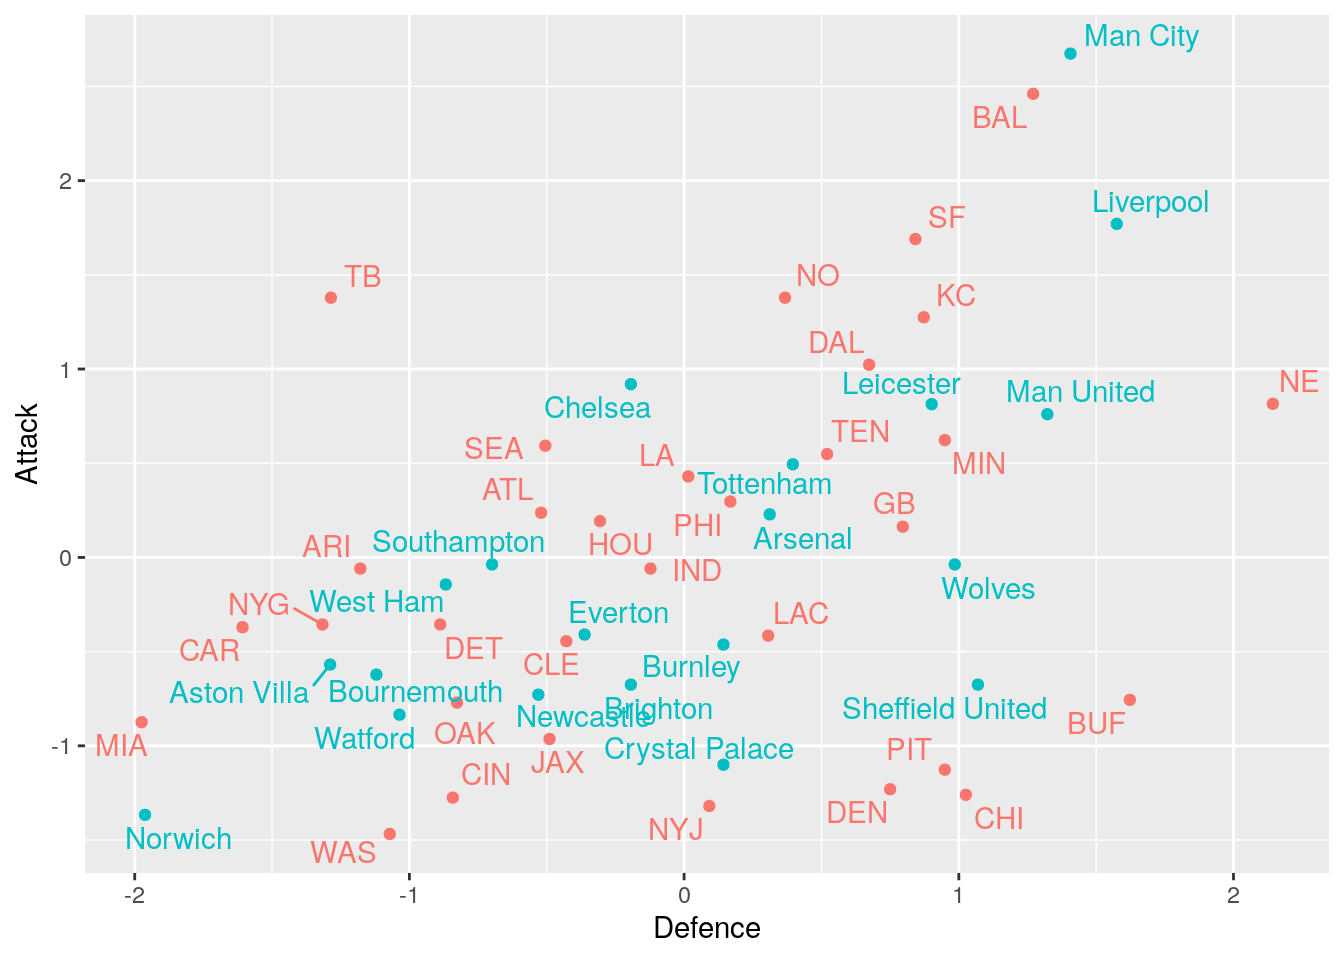
First off, there are a lot of points and, disappointingly, it can be hard to distinguish any obvious groups. The most obvious group appears to be the very best teams (Manchester City, Liverpool and Baltimore Ravens). We also have a grouping of teams that have a much better defence than attack (Sheffield United, Pittsburgh Steelers etc.).
So even though we have an attacking and defensive strength for all teams, by eye, we are struggling to form any groups. This is where we can utilize machine learning models; in particular unsupervised clustering algorithms. Unsupervised clustering algorithms aim to cluster similar data points with no knowledge of the underlying groups. We are going to use arguably the most well known clustering algorithm, k-means clustering. For more details on k-means clustering and its implementation in Python click here. For the R implementation see the project report.
The main issues with k-means clustering are:
- Choosing the number of clusters
- The algorithm doesn’t always converge to a unique solution
The second point means if we re-run the k-means algorithm with different starting values we will end up with different clusters - not ideal, or is it?
The aim of this post is to take a Premier League team and find a similar NFL team to support. This means we want as close to a one-to-one matching as possible. I don’t want to say I support Arsenal and then be told here’s 15 NFL teams that are like Arsenal. This gives us a clever way to choose the number of clusters; we run the algorithm with increasing number of clusters such that there is at least one team from each division in each cluster. So we are optimizing the number of clusters with the condition there is at least one team from each league in each cluster.
Okay so that’s the number of clusters sorted. Now to tackle the convergence of the algorithm to different solutions. Well to get as close to a one-to-one matching as possible we want the maximum number of clusters (subject to there being at least one team from each league in each cluster). Hence, we will re-run the algorithm (including the maximization of the number of clusters) many times and choose the clustering with the maximum number of clusters. This may not be the most rigourous or scientific way of optimizing the clustering but it works well with our aims.
The Final Groups
So after doing this what do we find? We get 13 clusters and the plot below shows all the teams and their cluster (different colours indicate different clusters).
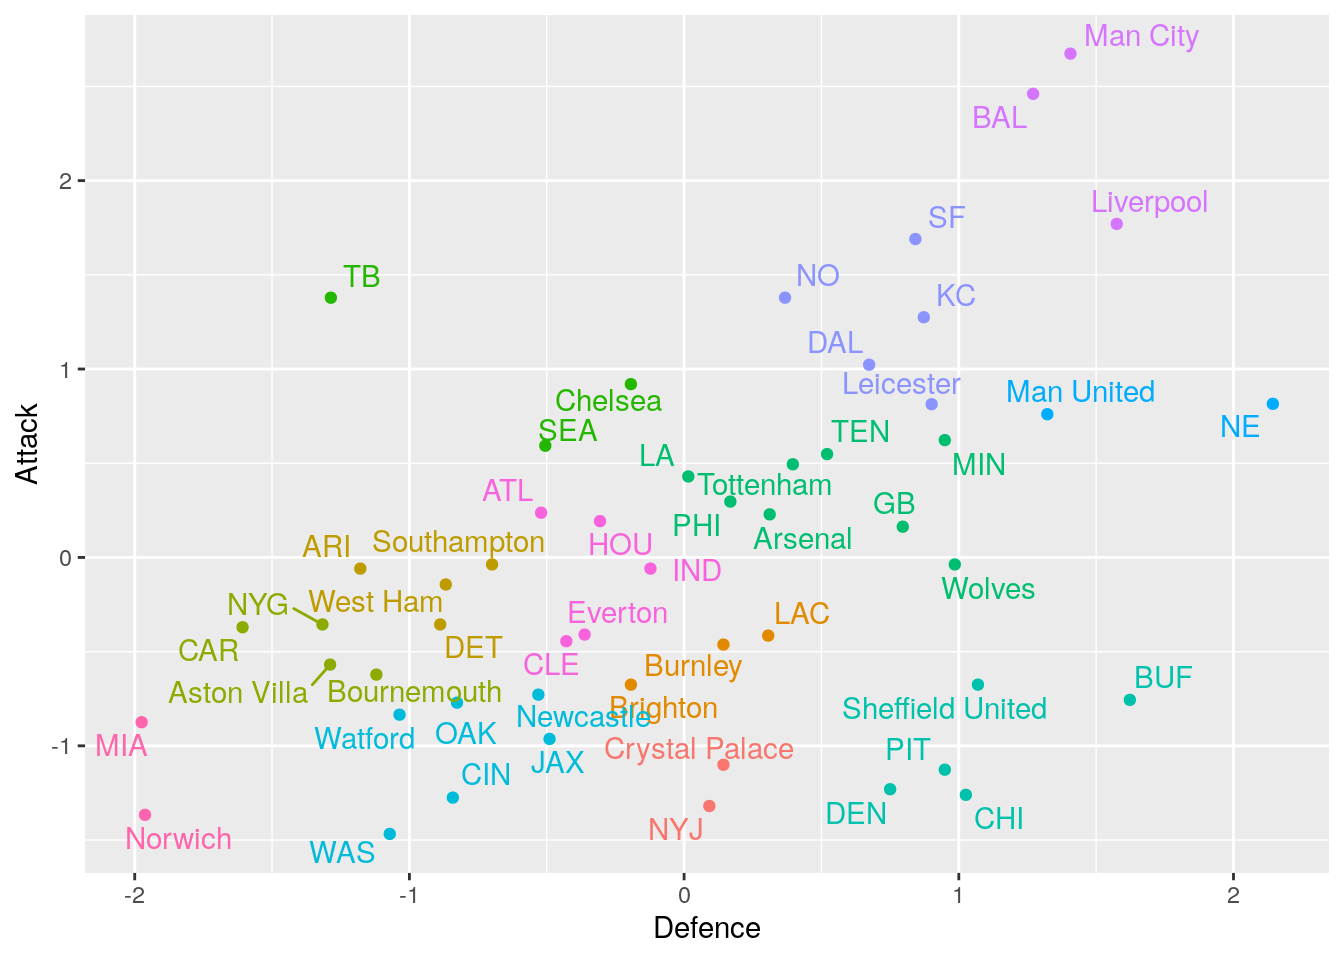
First, this clustering looks reasonable, points close to each other are clustered together and there’s nothing wild going on like Manchester City and the Miami Dolphins being grouped together.
I’ve picked out some of the more interesting groups and given my analysis of them below:
Miami and Norwich: True underdogs, both these teams have poor attacking and defensive strengths compared to the teams in their leagues.
Baltimore, Man City and Liverpool: The top dogs, these teams were the best in the league for attacking and defensive strengths. This is to be expected with Man City and Liverpool well ahead in the premier league standings and the Baltimore Ravens were the number 1 team in the NFL regular season.
Tampa Bay, Seattle and Chelsea: All-out attack, these teams have significantly more success attacking than they do defensively. The ‘we’ll score more than you’ sort of teams.
Denver, Pittsburgh, Chicago, Buffalo and Sheffield United: You shall not pass, these teams have rock solid defences, although they don’t offer much in the attacking sense. As a Bolton Wanderers fan, I feel this is the group I associate with and my NFL team the Steelers are here - win win!
New England, Manchester United The most hated teams? Arguably the two most hated teams in both leagues have been grouped together. This is more coincidence and because they are in the best-of-the-rest teams that favour defence over attack.
Not found your teams group yet? The table below contains all the groups, go ahead find your favourite Premier League team and see what similar teams there are in the NFL. Best of all, if your team wins the Superbowl in the future and anyone asks you why you support them, you can tell them it was all based on stats!
Table of all Groups
| Cluster | Team |
|---|---|
| 1 | NYJ |
| Crystal Palace | |
| 2 | LAC |
| Brighton | |
| Burnley | |
| 3 | DET |
| ARI | |
| Southampton | |
| West Ham | |
| 4 | NYG |
| CAR | |
| Aston Villa | |
| Bournemouth | |
| 5 | TB |
| SEA | |
| Chelsea | |
| 6 | TEN |
| PHI | |
| GB | |
| MIN | |
| LA | |
| Arsenal | |
| Tottenham | |
| Wolves | |
| 7 | BUF |
| PIT | |
| DEN | |
| CHI | |
| Sheffield United | |
| 8 | CIN |
| JAX | |
| OAK | |
| WAS | |
| Newcastle | |
| Watford | |
| 9 | NE |
| Man United | |
| 10 | KC |
| DAL | |
| NO | |
| SF | |
| Leicester | |
| 11 | BAL |
| Liverpool | |
| Man City | |
| 12 | CLE |
| HOU | |
| IND | |
| ATL | |
| Everton | |
| 13 | MIA |
| Norwich |